Line Graph Lessons & Worksheets - My Schoolhouse - Online Learning
A line graph shows how something changes over time.
Many line graphs are shown on grid paper. On the graph below, the
dark blue lines are the grid or graph paper. Dots called
points are placed on the grid paper. Then the points are connected
with lines and this makes the line graph.
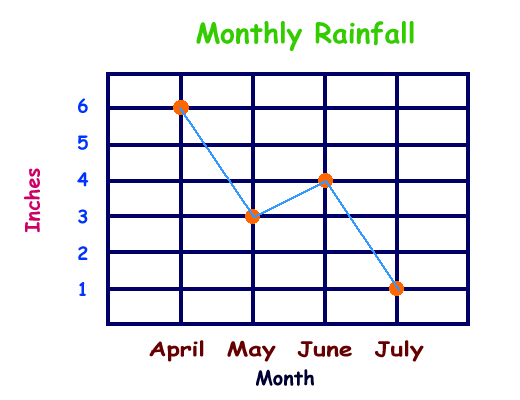
Every line graph has a title at the top. The title
on the graph below "Monthly Rainfall" is in green above the blue grid
paper.
To read a line graph, you find a point on the graph and
put your finger over it. Then use your finger to follow along the
grid paper line to find the number or word for that point.
For example, put your finger over the first gold point
on the graph below, move your finger left along the dark blue grid
line and you should run into the number 6. This point means 6
inches. Now go back to the first gold point again and move your
finger all the way down along the dark blue grid line. You
should run into April. This first gold point means that in the month
of April there was 6 inches of rainfall.
Now it is time for you to try some on your own.
Answer the questions below the graph.
1. How much rainfall was there in April?
inches
2. How much rainfall was there in May?
inches
3. How much rainfall was there in June?
inches
4. How much rainfall was there in July?
inches
5. Which month had the most rainfall?
6. Which month had the least rainfall?
7. How many more inches of rain were there in
April than in July?
inches