A Circle Graph is a helpful
way to organize and compare data. A Circle Graph is sometimes
referred to as a Pie Chart because the pieces
look like pieces of pie that you might eat.
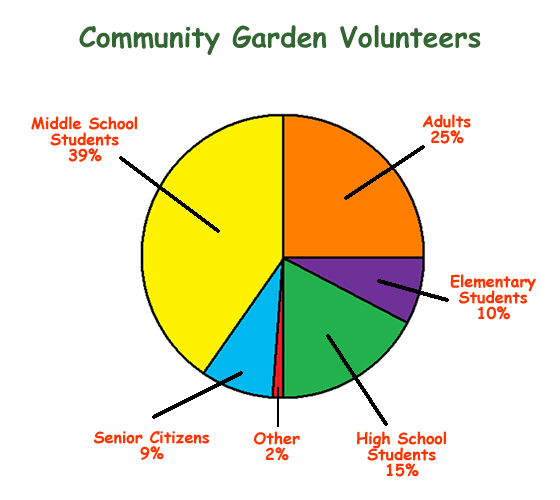
The entire Circle Graph represents the whole of
something. For example, in the graph below, the whole Circle
Graph is ALL(100%) of the people who volunteer in
the Community Garden.
Every Circle Graph is divided into parts. Each
individual piece of the pie tells you how many by the size, label, and
number of the piece. Individual pieces may then be compared to the
whole pie or graph. An individual piece may also be compared to
other individual pieces in the pie. The larger the individual part
or piece is, the more it represents.
Answer the questions below using the Circle Graph above.
1. What percentage of High School Students work in
the garden?
%
2. What percentage of Middle School Students work
in the garden?
%
3. What percentage of Elementary School Students
work in the garden?
%
4. What percentage of Adults work in the garden?
%
5. What percentage of Senior Citizens work in the
garden?
%
6. What percentage of "Other" work in the garden?
%
7. What group works in the community garden more
than any other group?
High
School Students
Adults
Middle
School Students
8. How many more percentage of Adults work in the garden
compared to High School
Students?
%
9. How many more percentage of High School
Students work in the garden compared to Senior Citizens?
%
10. Adults, Elementary Students, and High School
Students make up what percentage of people working in the community
garden?
%
Elementary & Middle School Lessons & Self-Correcting Tests for Children in all Subject Areas. If you have found an error or would like to make comments on this lesson,
please email us at:
MySchoolhouse.online@gmail.com
Copyright 1999-2024 by Educational Designers, LLC. All rights reserved. Lessons & Tests in Math, Reading, Spelling, Science, Language, and Social Studies.
"This site uses cookies from Google to deliver its services and analyze
traffic. Your IP address and user-agent are shared with Google along with
performance and security metrics to ensure quality of service, generate
usage statistics, and to detect and address abuse."