A line graph shows how data changes over time.
Many line graphs are shown on grid or graph paper. On the graph
below, the black lines are the grid paper. Dots called
points are placed on the grid paper. Then the points are connected
with lines and this makes the line graph.
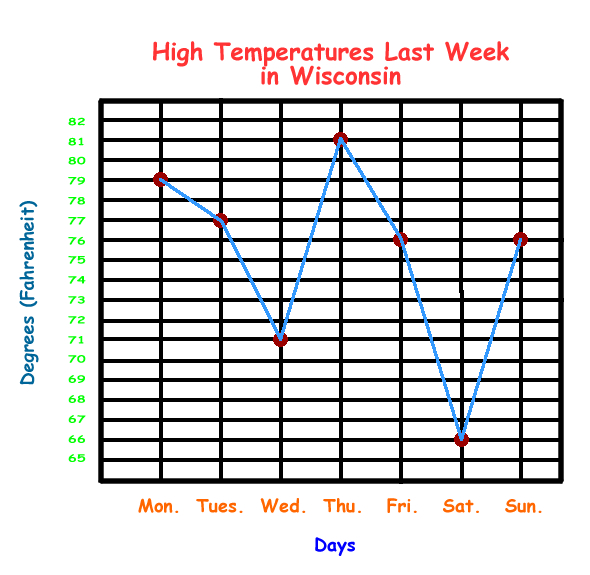
Every line graph has a title at the top. The title
on the graph below is in pink, "High Temperatures Last Week in Wisconsin".
One side of a line graph will have numbers and the other side will have another label, most likely
words.
To read a line graph, find a point on the graph and
put your finger over it. Then use your finger to follow along the
grid paper line to find the number or word for that point. For example, put your finger over the first red point
on the graph below. Move your finger left along the black grid
line and you should run into the number 79. This point means 79
degrees Fahrenheit. Now go back to the first red point again and move your
finger all the way down along the grid line. You
should run into Mon. This first red point means that on Monday the
high temperature was 79 degrees Fahrenheit.
Now it's time for you to try some on your own.
Answer the questions below the graph.
1. What was the temperature on Monday?
degrees
2. What was the temperature on Tuesday?
degrees
3. What was the temperature on Wednesday?
degrees
4. What was the temperature on Thursday?
degrees
5. What was the temperature on Friday?
degrees
6. What was the temperature on Saturday?
degrees
7. What was the temperature on Sunday?
degrees
8. Which day was the warmest?
A.
Monday
B.
Tuesday
C.
Thursday
9. Which day had the lowest temperature?
A.
Wednesday
B.
Thursday
C.
Saturday
10. How much hotter was the temperature on
Thursday than on Saturday?
degrees hotter on Thursday
11. What happened to the temperature from
Wednesday to Thursday?
A.
The temperature went down.
B.
The temperature went up.
C.
The temperature stayed the same.
12. What happened to the temperature from Tuesday
to Wednesday?
A.
The temperature went down.
B.
The temperature went up.
C.
The temperature stayed the same.
13. Which two days had the same high temperature?
A.
Tuesday and Friday
B.
Tuesday and Sunday
C.
Friday and Sunday
Elementary & Middle School Lessons & Self-Correcting Tests for Children in all Subject Areas. If you have found an error or would like to make comments on this lesson,
please email us at:
MySchoolhouse.online@gmail.com
Copyright 1999-2024 by Educational Designers, LLC. All rights reserved. Lessons & Tests in Math, Reading, Spelling, Science, Language, and Social Studies.
"This site uses cookies from Google to deliver its services and analyze
traffic. Your IP address and user-agent are shared with Google along with
performance and security metrics to ensure quality of service, generate
usage statistics, and to detect and address abuse."